Quantitative Trading: Build, Test, and Automate Strategies
Learn how quantitative trading works from first principles to full automation. See real examples, validation methods, and how to go from idea to execution with Obside.

What you will learn
- Clear definition of quantitative trading and its styles
- How to design, backtest, and validate strategies
- Risk and execution practices that preserve edge
- Concrete steps to automate with Obside Copilot
Table of contents
- What is quantitative trading?
- The core components of a quantitative trading system
- Types of quantitative strategies
- A practical blueprint to build your first strategy
- Real-world examples you can automate with Obside
- Benefits and considerations
- Metrics that matter
- Step-by-step, from idea to live trading with Obside
- Related articles
- Conclusion and next steps
- FAQs
- References
What is quantitative trading?
If you typed quantitative trading into a search bar, you are likely looking for a clear definition, real examples, and concrete steps to move from curiosity to an actionable process. You might be a discretionary trader curious about systematizing your edge, a data-driven investor wanting to scale, or an engineer exploring how models turn market data into decisions. This guide focuses on the core of quantitative trading, what it takes to build and validate strategies, how to avoid common pitfalls like overfitting, and how to automate your rules from idea to execution with tools like Obside so you can respond in real time.
Quantitative trading is a systematic approach to markets that uses mathematics, statistics, and programming to generate trading signals and manage risk. Instead of relying on gut feeling or subjective chart reading, you define precise rules based on data, then test those rules on historical and live data, and finally automate execution with strict risk controls.
Quantitative trading spans a spectrum of horizons and styles. It includes high-level factor investing across monthly timeframes, medium-frequency trend and mean reversion strategies, and event-driven systems that act on news or macro releases. The common thread is an evidence-based process. You collect data, engineer predictive features, test hypotheses, measure performance with robust metrics, and automate orders so the strategy behaves the same way every time.
For concise overviews, see definitions from reliable sources such as Investopedia on quantitative trading and Wikipedia on algorithmic trading.
The core components of a quantitative trading system
A robust quant workflow keeps you honest. It separates research, validation, and live trading, and it forces clear thinking about costs, risk, and capacity.
Data and feature engineering
Quality data is the foundation. Price and volume are the starting point, but many strategies also use fundamentals, options implied volatility, macroeconomic series, earnings calendars, news, and alternative data. Cleaning and aligning timestamps, handling outliers, and adjusting for splits or dividends are critical. From raw data, you build features, also called factors or signals. Typical examples are momentum over a lookback window, RSI or MACD variations, volatility measures like ATR, or cross-asset spreads. More advanced features include order book imbalance, sentiment, and regime indicators.
Alpha research and signal design
Alpha is the expected excess return of your signal after costs. You need a clear economic story. For example, momentum may work because trends persist due to behavioral biases and institutional constraints. Mean reversion may work when liquidity shocks revert. Pairs trading might profit from temporary dislocations in cointegrated assets. Your signal design should specify inputs, transformation, and decision boundary. A simple decision might be buy when 20 day return is positive and volatility is falling.
Backtesting and validation
Backtesting simulates your rules on historical data. You must incorporate trading costs, slippage, and realistic execution assumptions. Avoid look-ahead bias by ensuring signals only use information that would have been available at trade time. Combat overfitting through out-of-sample testing, walk-forward validation, and cross-validation. Consider a train period for parameter estimation, a validation period for model selection, and a test period to measure honest performance. Robustness checks include parameter sweeps, noise injection, and regime tests such as bull versus bear markets.
For a practical framework on rules and validation, see our guide on building a trading strategy, and use paper trading to compare live behavior with your backtests before committing capital.
Portfolio construction and risk
Position sizing matters as much as signal quality. Choices include equal weight, volatility targeting, risk parity, and mean-variance optimization. You also need constraints, like max weight per asset, sector caps, or leverage limits. Risk is monitored through drawdowns, volatility, correlation clustering, and scenario analysis. Many practitioners use volatility targeting to stabilize risk through time and apply dynamic position reduction during stress.
Execution and transaction costs
Paper alpha evaporates if you do not account for costs. Slippage, bid-ask spread, market impact, and fees vary by venue and instrument. Optimizing execution often includes limit orders, smart order routing, and time-slicing. For event-driven strategies, latency and fill probability matter. For medium-frequency systems, the main levers are holding period, trade frequency, and liquidity filters to keep turnover under control.
For a deeper dive into concepts, see Statistical arbitrage on Wikipedia and an overview of execution costs on Investopedia.
Types of quantitative strategies
Quantitative trading is not one thing. It is a toolbox. The right tool depends on your market, timeframe, risk tolerance, and data access. For a broader map of approaches, explore our overview of trading strategy types and styles.
Momentum and trend following
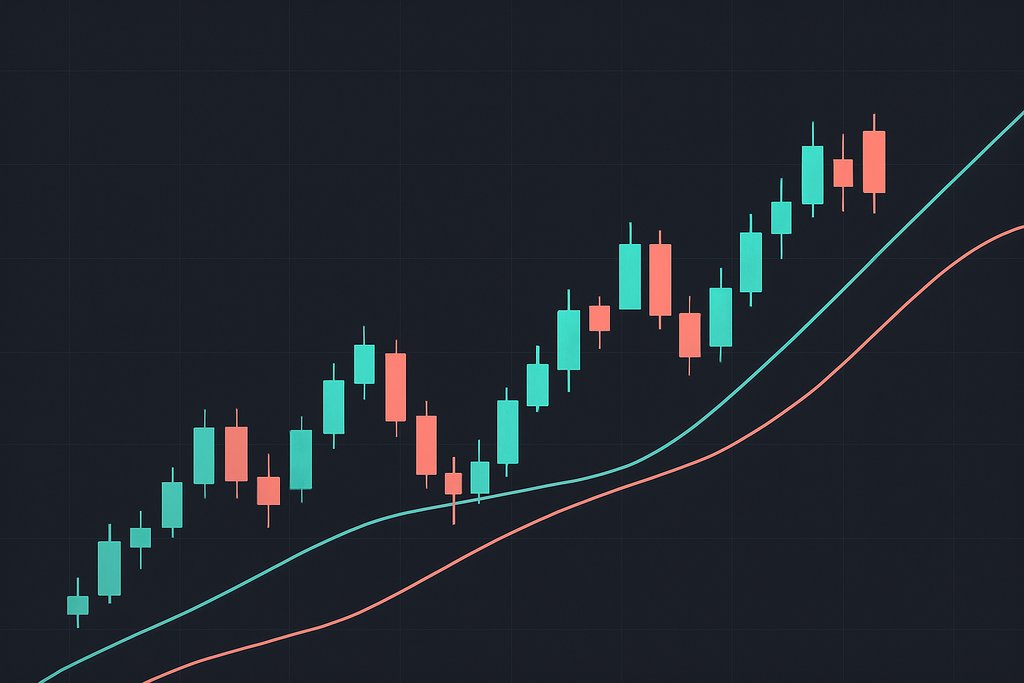
Momentum strategies buy assets that have gone up and sell those that have gone down, often measured over 3 to 12 months on higher timeframes or 20 to 50 bars on intraday charts. Trend following tries to ride persistent directional moves using indicators like moving average crossovers or Donchian channels. Both styles benefit from diversification across assets and careful risk scaling, and they are sensitive to regime shifts when markets range.
Mean reversion and pairs trading
Mean reversion assumes prices overshoot and revert. On equities, short-term reversals after sharp moves are common, but costs can eat the edge if turnover is too high. Pairs trading looks at two related assets, like two bank stocks, and trades the spread when it deviates from its typical relationship. The statistical foundation often involves correlation and cointegration testing to select pairs likely to revert.
Factor and multi-asset allocation
Factor investing ranks assets on attributes like value, quality, momentum, or low volatility, then builds diversified portfolios. These strategies rebalance at lower frequencies and aim to harvest long-standing market anomalies documented in academic literature. Multi-asset versions combine equities, bonds, commodities, and currencies, balancing risk and improving resilience across regimes.
Machine learning in quant trading
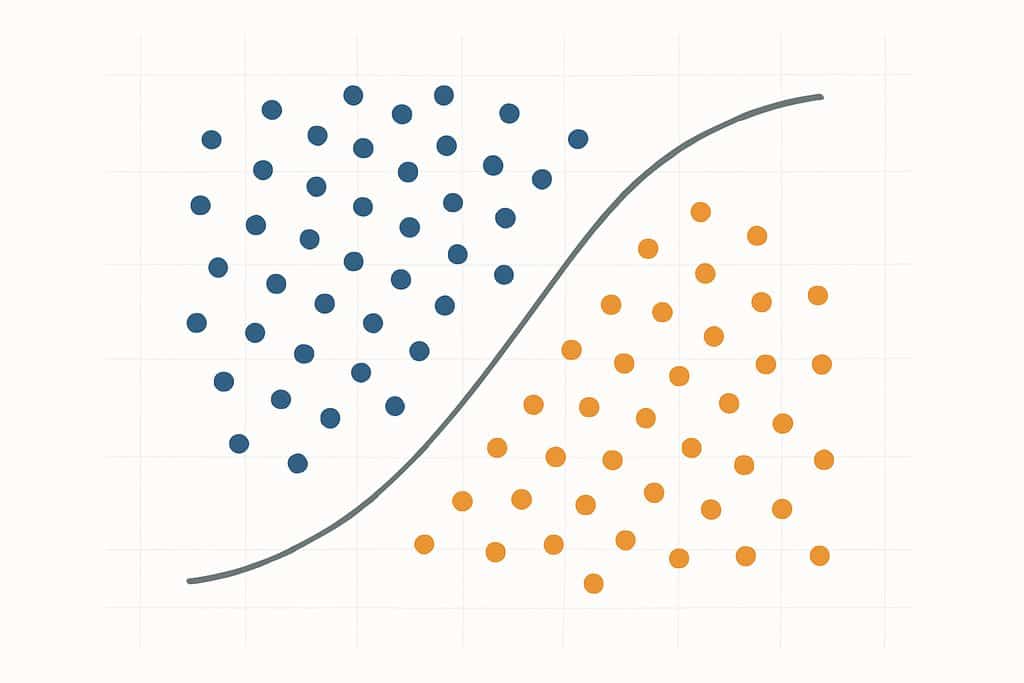
Machine learning can find nonlinear relationships and interactions between features. It is powerful for classification tasks, like predicting next period up or down, or regression tasks, like forecasting returns. The dangers are overfitting and unstable models if features leak future information or if regimes change. Use strong cross-validation, regularization, and simple model baselines as a sanity check. A good practice is to start with linear models and compare ML only if you have enough data and a clear reason. For context, read about Fama French factors and performance measures such as the Sharpe ratio.
A practical blueprint to build your first quantitative strategy
Let us walk through a concrete process you can adapt. We will design a medium-frequency strategy that combines a trend filter with a pullback entry, with rules simple enough to validate and automate.
Start by selecting an instrument and timeframe. Suppose you choose BTCUSD on a 2 hour chart. The idea is to trade in the direction of the dominant trend, but only after a pullback that resets momentum. Define a trend filter using a Supertrend or a 50 period moving average, then use RSI to detect pullbacks inside the trend. For risk, use ATR-based stops and a trailing exit.
The rules might read as follows. Go long when the 2 hour Supertrend is bullish, the 8 hour Supertrend is also bullish, and the 2 hour RSI is below 60 to avoid overbought entries. Place a stop loss at 2 ATR below the entry and a trailing stop at 5 ATR. Exit when the 2 hour Supertrend flips bearish. For shorts, mirror the logic if you allow shorting.
Translate this into a backtest. Use at least 2 to 3 years of intraday data, incorporate realistic fees and a slippage model like 1 tick per trade, and risk a fixed percentage of capital per position. Evaluate Sharpe, max drawdown, and turnover. Perform a parameter sweep on the RSI threshold and ATR multiple to ensure the edge is not a narrow spike. Split the sample into pre and post a major regime shift to test stability.
Once satisfied with robustness, define position sizing. Volatility target the position so that each trade aims for a similar risk contribution. For example, set position size proportional to 1 divided by recent ATR so that more volatile periods get smaller positions.
Finally, automate your rules. With Obside, you can describe the rules in plain language using Obside Copilot. The assistant translates intent into an actionable strategy with alerts, order placement, stops, and trailing logic, then you can backtest it in seconds on the platform before going live.

Real-world examples you can automate with Obside
Quantitative trading often blends price-based signals with event and macro triggers. Obside makes this blend natural because you can trigger alerts on prices, indicators, news, and macro data, then attach automatic actions.
You might instruct the platform to notify you when RSI crosses 70 on EURUSD and MACD turns bearish, then place a small short with a tight stop. You could monitor Bitcoin for a breakout above a specific level with a surge in daily volume, then pyramid the position as momentum confirms. If a hurricane approaches the Gulf of Mexico, you could buy oil with a predefined stop and a time-based exit if the move does not materialize. If new tariffs are announced on a sector, you could reduce or exit exposure quickly. You can also run steady allocation rules, for example keep 50 percent of the portfolio in Bitcoin, 25 percent in Ethereum, and 25 percent in USDC, rebalancing on volatility changes.
“Alert me if Bitcoin rises above 150,000 and daily volume doubles.”
“Buy 50 dollars of Tesla if Elon Musk tweets about it.”
“Keep 50 percent BTC, 25 percent ETH, 25 percent USDC and rebalance on volatility.”
The key advantage is speed from idea to execution. Describe your condition or full strategy to Obside Copilot, validate with the ultra-fast backtesting engine, then connect your broker or exchange to automate. Professionals appreciate that Obside was awarded the Innovation Prize 2024 at the Paris Trading Expo and is supported by Microsoft for Startups, which speaks to reliability and pace of innovation.
For broader context on system design, see our introduction to AI trading bots and how they integrate with research and execution stacks.
Benefits and considerations of quantitative trading
Quantitative trading brings discipline. Once your rules are defined, they execute the same way every time, which reduces the emotional noise that hurts discretionary decision making. It is scalable because you can test and run many instruments and variations in parallel. It is measurable, which means you can diagnose whether the edge is fading or if performance is within expected variance.
There are real challenges. Overfitting is the biggest enemy. If you test too many parameters and pick the best historical result, your live returns may disappoint. Combat this by keeping models simple, preferring broad plateaus of performance over sharp peaks, and validating out of sample. Markets change regimes. A trend strategy that worked in a low volatility bull market could stall in choppy conditions. Mitigate with diversification across styles and assets, and with regime filters that reduce risk during adverse environments. Costs matter, especially at high turnover. Design your signal with holding periods and liquidity filters that survive fee and slippage headwinds. Data quality issues and survivorship bias can also mislead you. Use point-in-time datasets and test delisted securities when relevant.
Infrastructure used to be a hurdle, but less so today. With platforms like Obside you can handle research and automation without building a custom stack, which lowers operational risk and speeds iteration.
Metrics that matter for quantitative strategies
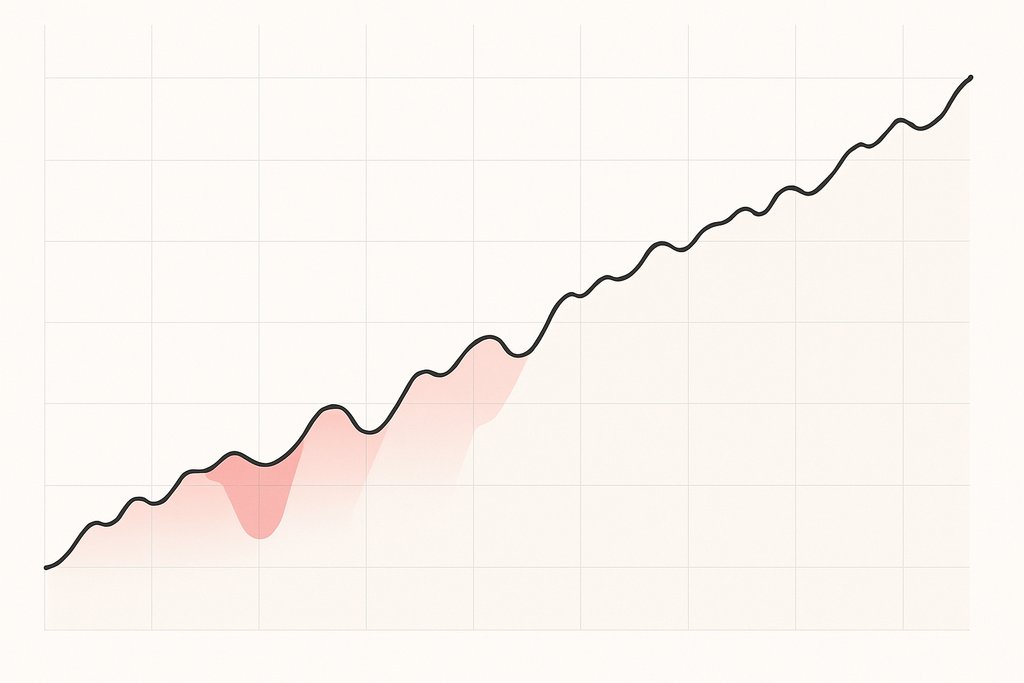
When you evaluate a strategy, think in terms of risk-adjusted and path-aware metrics. The Sharpe ratio summarizes excess return relative to volatility, although it assumes symmetry. Sortino ratio focuses on downside volatility, which many traders prefer. Max drawdown captures the worst peak to trough decline and is crucial for psychological and capital resilience. Hit rate can be misleading if risk reward is unbalanced, so combine it with average win and average loss to assess payoff skew. Profit factor, turnover, and capacity help you understand costs and scalability. Alpha decay measures how quickly signals lose power after they trigger, which guides rebalancing frequency.
For definitions, the Sharpe ratio on Investopedia is a good reference, and you can explore Sortino ratio and drawdown pages there as well.

Step-by-step, from idea to live trading with Obside
Start with one clear hypothesis. For example, on a 15 minute chart, buy when there is a bullish divergence on RSI with price making a lower low while RSI makes a higher low, then set a stop on the low of the day and a 10 percent take profit. In Obside, you can describe this in natural language. The platform builds the conditions, sets the stop and take profit, and creates a full strategy template.
Next, validate with backtests. Adjust the RSI lookback and divergence tolerance, then check whether performance is stable. If the equity curve depends on a narrow parameter, rethink the design. If it is robust across reasonable ranges, proceed.
Add risk controls. You could incorporate a trailing stop using 5 times the 2 hour ATR, or add a higher timeframe confirmation so you do not fight the major trend. You can also set global portfolio rules, for instance sell all positions if the S&P 500 drops by 10 percent, which protects you during systemic events.
Finally, connect your broker or exchange and go live with modest size. Monitor live metrics and compare them to backtest expectations. Obside automations help you keep the discipline of the system while you iterate on improvements.
Related articles
- AI Trading Bot: What It Is and How to Build One That Trades
- Buy and Sell Trading: A Practical, Proven Guide to Rules
- Types of Trading: Strategies, Styles, and Examples
- Trading Strategy: Build, Test, and Automate Rules That Last
- Paper Trading: Complete Guide to Practice Strategies
- Investment Guide: Build Wealth in Any Market | Step-by-Step
- Bitcoin Investment Calculator: Plan Your BTC Strategy
- Autopilot Investment App: A Complete Hands-Off Guide
- AI Investing: From Hype to Practical Strategies That Work
- Investment Strategies: Build, Test, and Automate Yours
- How to Invest: A Practical Guide to Start and Succeed
- Forex Trading Guide: How the Currency Market Works
- Trading in 2025: Strategies, Tools and Day Trading Guide
- AI Stocks: How to Invest and Profit from the AI Boom
- Best Stocks to Buy Now: A Practical Investor Guide
Conclusion and next steps
Quantitative trading turns ideas into rules, and rules into repeatable results. The craft is in building features with economic intuition, validating honestly with robust methods, and executing with attention to costs and risk. It is not magic, and it requires patience, but the payoff is a process that can scale beyond the limits of discretionary decision making.
If you are ready to take the next step, pick one instrument and timeframe, choose a simple rule set, and run your first backtests. Then use Obside Copilot to translate your hypothesis into a working strategy, validate it with the ultra-fast backtester, and connect your accounts to automate when you are confident.
Want to see how Obside fits your workflow and explore strategies built by others before you commit?
Written by Thibaud Sultan
FAQs about quantitative trading
What is the difference between quantitative trading and algorithmic trading?
The terms often overlap. Quantitative trading usually refers to the research and model side, where you build data-driven signals and risk rules. Algorithmic trading focuses on the automated execution of those rules. In practice, most quant strategies are implemented algorithmically, so people use the terms interchangeably.
Do I need to know how to code to start quantitative trading?
Coding helps, especially for custom data and models. That said, you can start without coding by using platforms that turn natural language into trading logic. With Obside Copilot, you describe your conditions in plain English, backtest them, and automate with your broker connection. As your needs grow, you can add more advanced logic.
How much capital do I need for quantitative trading?
It depends on the market and style. Higher frequency strategies need more capital to overcome costs and access tight spreads. Medium frequency swing systems can start smaller, provided you respect position sizing and fees. The priority is not size but process, which you can develop with paper trading and small risk.
Which markets are best for quantitative strategies?
Markets with good liquidity and clean data are ideal. Many quants start with liquid equities, major forex pairs, index futures, and large cap cryptocurrencies. For event-driven or news-based strategies, instruments with clear catalysts can be attractive. Always align your holding period with the market’s liquidity profile to manage slippage.
How do I avoid overfitting when designing quant strategies?
Keep models simple, use out-of-sample tests and walk-forward validation, incorporate realistic costs, and prefer broad parameter robustness over narrow optimization. Compare your strategy to naive baselines like buy and hold or random entry with the same exit rules. If your edge survives these tests, it is more likely to be real.
Can I run both event-driven and indicator-based strategies together?
Yes. Many portfolios blend technical signals with event triggers to diversify. Obside supports this mix by allowing conditions based on prices, indicators, news, and macro data, all under one automation that prioritizes risk rules and execution discipline.
