Technical Analysis: Read Markets Like a Pro (Guide)
Master a practical, rules-based approach to reading charts, timing entries and exits, and automating your plan from alert to execution.
What you’ll learn
- Core concepts of price, volume, and trend
- How to turn patterns and indicators into rules
- Step-by-step strategy design with risk control
- Backtesting without overfitting
- Real-time alerts and automation with Obside
Table of contents
- What Is Technical Analysis?
- How Technical Analysis Works
- Price Charts and Trend Analysis
- Chart Patterns in Technical Analysis
- Indicators and Oscillators
- Multi Timeframe Confluence and Context
- How to Build a Strategy
- Backtesting and Optimization
- Real Time Alerts and Automation with Obside
- Risk Management and Trade Management
- Technical Analysis vs Fundamental Analysis
- Common Mistakes and How to Avoid Them
- Benefits and Considerations
- Practical Examples to Try
- Conclusion and Next Steps
- Related articles
- Frequently Asked Questions
What Is Technical Analysis?
Technical analysis is the study of price and volume to forecast potential moves. It assumes all known information is reflected in price, and that human behavior creates patterns that tend to repeat. Instead of reading earnings reports, technical traders analyze trends, support and resistance, and indicators that quantify momentum or volatility.
At its core, technical analysis answers three questions. What is the current market state, trend or range. Where are high interest areas such as support, resistance, and value zones. When is it statistically favorable to act based on a confluence of signals, momentum, or breakouts.
For additional background, see high-quality primers like Investopedia’s introduction to technical analysis or Wikipedia’s page on technical analysis. This guide focuses on applied, step by step usage.
How Technical Analysis Works: Price, Volume, and Market Psychology
Markets are driven by supply and demand. Uptrends form when buyers support higher prices, downtrends form when sellers remain in control, and ranges occur when supply and demand are balanced. Volume reveals conviction. Rising price with rising volume often signals strength, while rising price with falling volume can warn of exhaustion.
Psychology is central. Humans react in herds, round numbers attract attention, and prior highs or lows act as memory points where stops and take profits cluster. This behavior is why support and resistance matter, and why breakouts or breakdowns can attract momentum flows.
The job of technical analysis is to quantify these behaviors and turn them into rules. For example, buy the first pullback to a rising 20-period moving average if RSI remains above 50, or sell if price closes below the 50-day moving average with MACD turning negative.
Price Charts and Trend Analysis
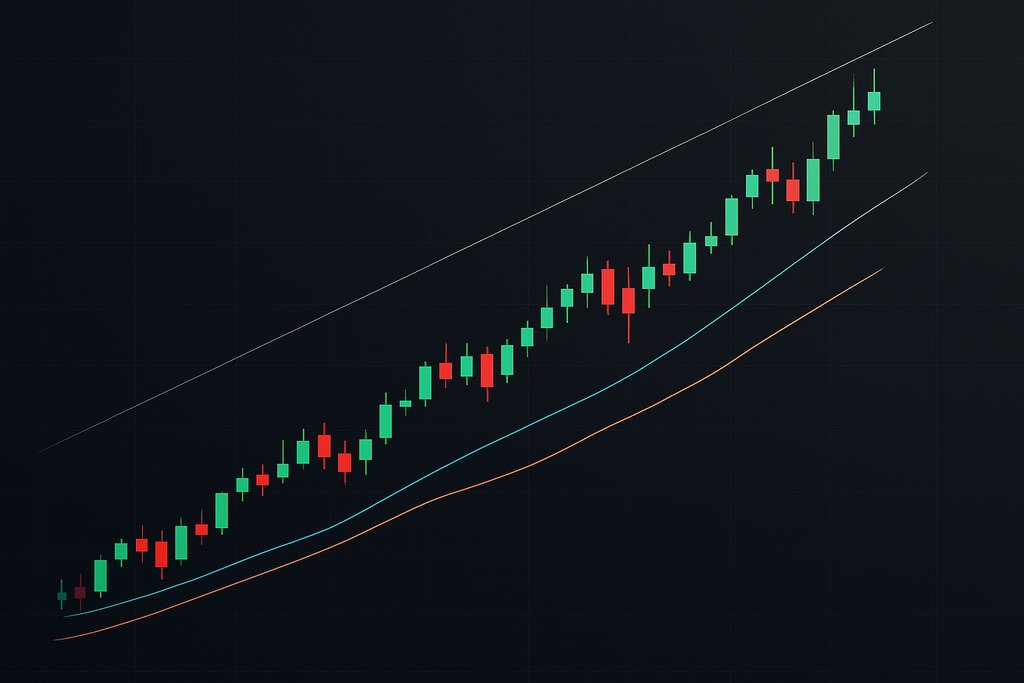
The basic building blocks are price charts and trends. Many traders use candlesticks because they show open, high, low, and close clearly. Line charts and OHLC bars can also work if you prefer simplicity.
Trend analysis starts by identifying higher highs and higher lows for an uptrend, or lower highs and lower lows for a downtrend. Draw trendlines to connect swing points, then look for bounces or breaks. In ranges, horizontal support and resistance become more critical. Keep the chart clean, focus on price structure first, then add indicators to confirm.
Timeframes matter. A 15-minute chart can be in a downtrend while the daily chart is bullish. Top down analysis helps. Start on higher timeframes to set context, then drill down for entries. If the weekly trend is up and the daily chart pulls back into support, drop to the 1-hour chart to find a reversal candlestick or a momentum cross that refines your entry.
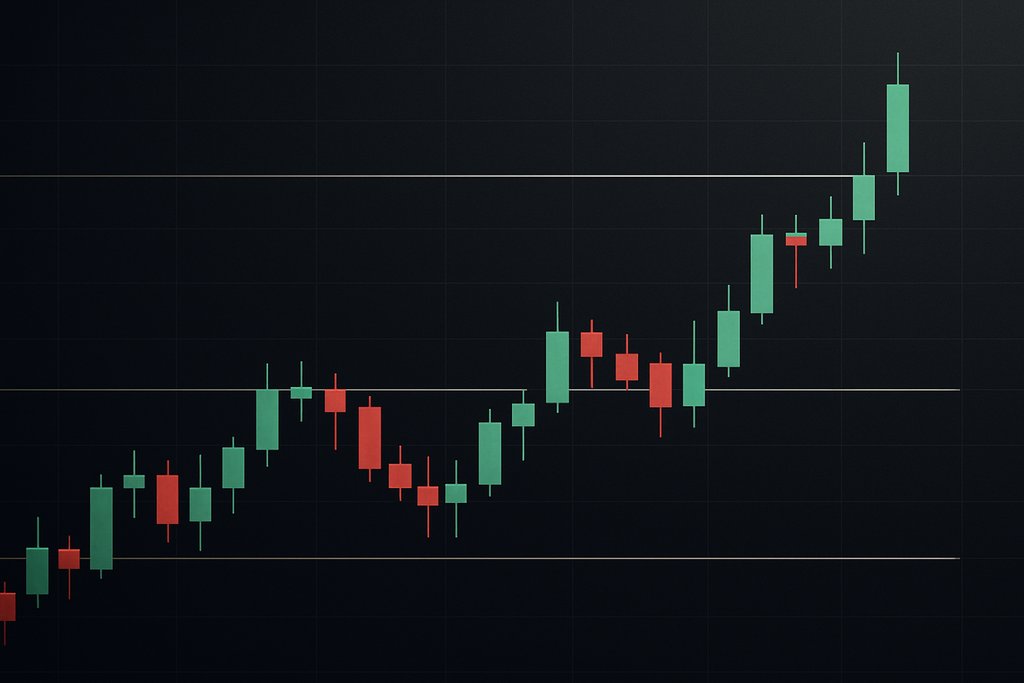
Chart Patterns in Technical Analysis
Chart patterns are visual summaries of crowd behavior. They are not magic, but they can help identify likely inflection points when combined with trend and volume context. Reversal patterns like head and shoulders, double tops, and double bottoms suggest shifting control between buyers and sellers.
For deeper pattern work, learn how to trade a double top in our guide to M pattern trading, and compare it with a double bottom using W pattern trading. Continuation patterns like flags, pennants, and triangles often signal pauses before a trend resumes, especially when volume contracts during consolidation and expands on breakout.
Indicators and Oscillators: From Moving Averages to RSI and MACD
Indicators convert price and volume into formulas that quantify trend, momentum, volatility, or mean reversion. You do not need many. Understand a few deeply and know when they work best.
Moving averages smooth price. Simple moving averages weight all periods equally, while exponential moving averages emphasize recent price. Many traders track the 20, 50, and 200 period moving averages. Pullbacks to a rising 20-day EMA can offer entries if momentum remains positive.
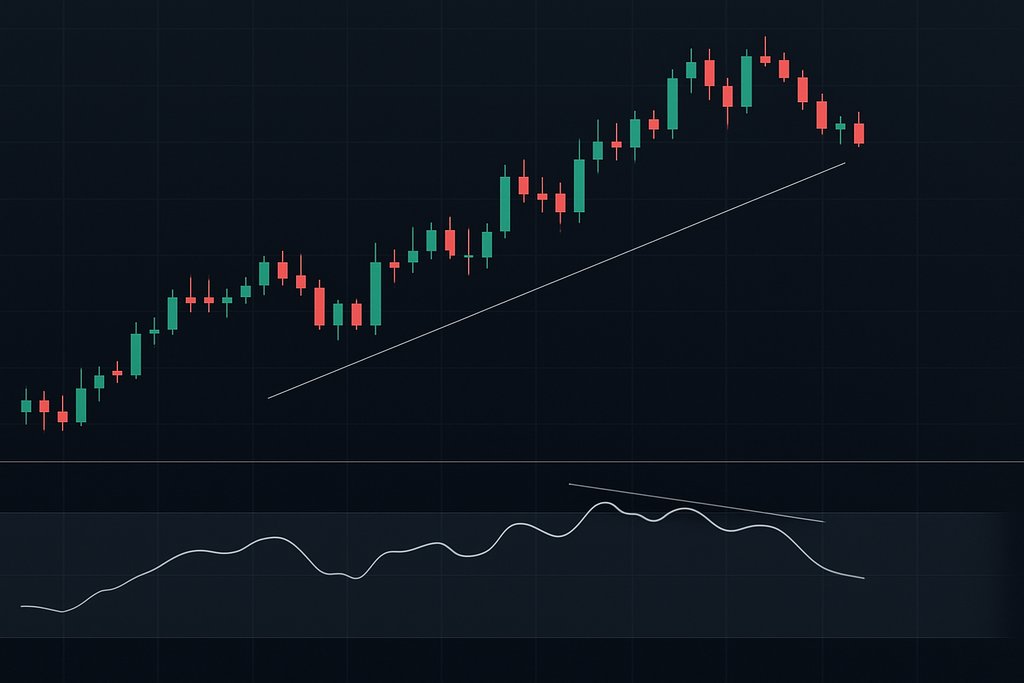
MACD measures trend momentum using moving averages. A cross above the signal line can indicate strengthening bullish momentum, while a cross below can hint at bearish shifts. Divergences between price and MACD sometimes precede reversals, especially near key levels.
RSI oscillates between 0 and 100 and is helpful as a momentum filter. Above 70 can be overheated in ranges, while trends can keep RSI elevated. Many traders prefer RSI above 50 as a bullish filter. For a deeper dive, see our RSI indicator guide.
Bollinger Bands measure volatility around a moving average. Band contractions signal low volatility and potential breakouts. ATR measures volatility and is excellent for dynamic stop placement. Other tools include Stochastic, Ichimoku, VWAP, and Supertrend. Define what each contributes so your toolkit stays coherent.
Multi Timeframe Confluence and Context
False signals shrink when you add context. Align higher timeframe direction with lower timeframe entries. Use the daily or weekly chart to define the primary trend, then look for entries on the 1-hour or 4-hour when price pulls back to support and momentum turns up.
Confluence happens when independent signals agree. For example, price pulls back to the 50-day SMA, RSI holds above 50, and a prior resistance turns into support. Add a small bullish divergence on the 4-hour MACD and your setup quality rises with clear validation and invalidation points.
How to Build a Technical Analysis Strategy Step by Step
Robust strategies define market, timeframe, entry, exit, risk, and review. Pick liquid instruments and timeframes that fit your schedule. Define a directional bias using trend filters such as price above the 200-day SMA. Add a momentum filter like RSI above 50 or MACD above its signal line.
Create simple, testable entries. For example, buy a pullback to the 20-day EMA within an uptrend when a bullish engulfing candle forms with above average volume. Or buy a breakout on a daily close above a 20-day high with a clear volatility expansion. Set exits with both protection and realism using ATR-based stops, partial profits at fixed risk multiples, and a trailing stop for the remainder. Position sizing should cap risk per trade to a small percentage so no single outcome can derail your account.
Market filter: price above 200-day SMA. Entry: first pullback to rising 20-day EMA with RSI above 50 and a bullish engulfing candle. Stop: 2 ATR below entry. Take profit: partial at 1.5R, then trail at 3 ATR. Exit if price closes below the 50-day SMA.
Market filter: 50-day SMA above 200-day SMA. Entry: close above a 20-day high with daily volume at least 1.5 times the 20-day average. Stop: 1.5 ATR below the breakout low. Take profit: partial at 2R, then trail with a 10-day low stop.
Document your rules clearly so you can automate them. Tools like Obside let you describe rules in natural language, backtest them in seconds, and deploy live with connected brokers and exchanges.
Backtesting and Optimization Without Overfitting
Backtesting validates your rules before risking capital. Look beyond headline returns and study drawdowns, volatility, win rate, average win and loss, and profit factor. Check consistency across markets and time periods.
Obside’s ultra fast engine helps you iterate quickly. Describe a setup such as Supertrend turning bullish on the 2-hour chart while RSI is below 70 and the 8-hour Supertrend is also bullish, with a trailing stop at 5 ATR. Obside converts it into a testable system you can optimize and then execute.
Real Time Alerts, Automation, and Execution with Obside
Technical analysis becomes powerful when you act without delay. Obside turns your ideas into market actions in seconds. Chat with Obside Copilot in plain language to create smart alerts, automatic orders, and full portfolio strategies that react to price, indicators, news, and macroeconomic data.
Examples include alerts like “Bitcoin above 150,000 with daily volume doubling,” or “RSI crosses 70 on EUR/USD with MACD turning bearish.” Actions can follow alerts, such as buying a fixed amount of Tesla on a specific event or reducing risk if a market drops by a threshold. You can even automate allocation rules and trailing risk management.

When you are ready, explore the platform at beta.obside.com and create an account at beta.obside.com/register. For deeper workflow ideas, learn more in our guide to trading automation.
Risk Management and Trade Management
A technical edge requires risk control. Volatility-based stops using ATR adapt better than fixed distances. A stop at 2 ATR below entry gives a trade room while keeping risk proportional to current conditions.
Keep risk per trade small, such as 0.5 to 2 percent. Mean reversion systems often take profits faster, while trend followers trail and let winners run. Simpler rules are easier to automate and follow consistently.
Technical Analysis vs Fundamental Analysis
Technical and fundamental analysis are complementary. Fundamentals help decide what to trade, technicals help decide when to trade. If macro drivers are bullish for energy, build a watchlist, then apply technical rules for pullbacks or breakouts. With Obside you can tie both worlds together by reacting to prices, indicators, news, and macro events with one set of rules.
To push further into rules-driven execution, see our overview on building and automating strategies.
Common Mistakes in Technical Analysis and How to Avoid Them
Common pitfalls include stacking too many indicators, which creates conflicting signals. Start with price structure, add one or two indicators that serve clear roles, and require confluence.
Overfitting is another trap. A perfect backtest likely captured noise. Keep parameter ranges broad, test out of sample, and prefer durable concepts across markets. Include realistic costs such as spreads, commissions, and slippage. Do not skip the risk plan. Write rules, log trades, review monthly, and refine what does not add edge.
Benefits and Considerations of Technical Analysis
Technical analysis is universal, visual, and quantitative. It scales from intraday to multi month horizons and lends itself to automation, which reduces hesitation and emotional mistakes.
There are considerations. Some signals can be subjective and regimes change. False breakouts are part of the game, so confirmation and risk control are essential. Liquidity and slippage affect real results. These are reasons to build robust rules and execute them consistently.
Practical Technical Analysis Examples You Can Try Today
Focus on a market basing below clear resistance. Require the 50-day SMA above the 200-day SMA. Enter on a daily close above the base high when volume is at least 1.5 times the 20-day average. Place a stop 1.5 ATR below the breakout low. Take partial profit at 2R, then trail with a 10-day low stop. In Obside, create an alert for the 20-day high plus a volume filter and attach a buy action when confirmed.
In an uptrend defined by price above the 200-day SMA, wait for a pullback to the 20-day EMA with RSI above 50 and a bullish reversal candlestick. Stop at 2 ATR below entry. Scale out at 1.5R, trail at 3 ATR. You can write this in Obside Copilot in plain language and let automation handle orders and risk.
In a range where the 20-day SMA is flat, consider buying when price closes below the lower band and RSI is below 30. Exit on a close to the middle band or RSI back above 50. Keep risk tight and avoid trending conditions by adding a filter that the 50-day SMA slope is near flat.
Conclusion and Next Steps
Technical analysis gives you a practical framework for timing trades with discipline. By focusing on price, volume, trends, and a small set of well understood indicators, you can turn subjective chart reading into objective rules. Backtesting those rules, tracking performance, and enforcing risk management form the foundation of a durable edge.
When you are ready to connect your rules to real world execution, Obside lets you describe strategies in plain language, validate them in seconds, and run them automatically with your connected brokers and exchanges.
Frequently Asked Questions
Does technical analysis really work?
Technical analysis is a decision framework, not a prediction machine. It works when you define clear rules, test them on data, and execute with risk management. Many professionals use technical analysis for timing even when fundamentals drive selection. The edge comes from consistency and discipline.
Which timeframe is best for technical analysis?
The best timeframe is the one you can follow consistently. If you have limited screen time, the daily or 4-hour chart often works better than intraday. Use a higher timeframe for context and a lower timeframe for entries, then apply the same rules repeatedly.
What are the most reliable indicators?
No indicator is reliable all the time. Moving averages define trend, RSI is a useful momentum filter, MACD quantifies momentum shifts, and ATR is excellent for risk management. Choose one or two that fit your strategy and validate them with backtesting.
Can technical analysis be automated?
Yes. Platforms like Obside let you describe rules in plain language and convert them into alerts, orders, and complete strategies. You can combine price conditions with indicators, news, and macro triggers so your system reacts in real time.
Is technical analysis useful for crypto and forex as well as stocks?
Absolutely. Technical analysis is based on price and volume, which apply to any liquid market. Adjust parameters for volatility or session hours, but the core principles are universal.