Forex Backtesting: Validate Your Strategy With Data
Learn how forex backtesting turns ideas into evidence by testing rules on historical data with realistic costs, so you can trade with confidence.

What you’ll learn
- How forex backtesting proves an edge before live risk
- Validation methods that reduce false confidence
- Key metrics, pitfalls, and a complete example workflow
Table of contents
- What is forex backtesting
- The forex backtesting setup that actually works
- Methods for robust forex strategy backtesting
- The metrics that matter in forex backtesting
- Pitfalls that ruin forex strategy backtesting
- Practical example: how to backtest a simple forex strategy
- Manual vs automated forex backtesting
- Forex backtesting in seconds with Obside
- Benefits and considerations of forex backtesting
- Conclusion: your next steps
- FAQ on forex backtesting
What is forex backtesting
Forex backtesting is the process of applying your trading rules to historical currency data to evaluate performance before you trade live. If your rules say buy when RSI crosses above 30 and the 200 SMA is rising, backtesting runs that logic on past price data, then calculates results like win rate, average win, average loss, drawdown, and Sharpe ratio. The goal is to assess whether your edge is statistically meaningful, robust across market regimes, and feasible once you account for spreads, slippage, and swaps.
In practice, there are two approaches. Manual backtesting involves scrolling through charts bar by bar and recording hypothetical trades in a spreadsheet. Automated backtesting uses software to execute your rules programmatically over historical data. Automated testing is faster, repeatable, and allows for deeper analysis like parameter sweeps and walk-forward validation. To choose the right tool set, see our guide on backtesting software you can trust.
If you want formal definitions for concepts like Sharpe ratio and overfitting, see Investopedia’s overview of backtesting and Wikipedia’s page on the foreign exchange market.
The forex backtesting setup that actually works
The quality of your results depends on the quality of your inputs. Start with clean, relevant data. For intraday strategies, minute or tick data captures spread dynamics and execution details. For swing strategies, hourly or daily bars are often enough. Because spreads are dynamic and can widen around news and session transitions, your backtest should model a realistic spread, not a fixed ideal.
Your instrument list matters too. Major pairs like EUR/USD and USD/JPY have tight spreads and deep liquidity, so execution assumptions are more stable. Exotic pairs can be attractive but spreads, slippage, and swaps can dominate your edge.
Model trading frictions correctly to avoid inflated results. Include:
- Spread and slippage that vary by time of day or volatility
- Commissions charged by your broker
- Swap or rollover if you hold positions overnight
- A trade delay that enters on the next bar after a signal
If your platform supports it, use session filters to avoid illiquid periods or high impact news windows. Even if you trade through news, your test should replicate spread widening and slippage around releases. For context on liquidity and execution, review market microstructure basics on Wikipedia.
Methods for robust forex strategy backtesting
Once you have a clean setup, use validation methods that reduce false confidence.
Out-of-sample testing
Split your data into in-sample and out-of-sample. Build and tune on the in-sample period, then lock rules and evaluate on the out-of-sample period. This simulates future performance and reduces data snooping bias.
Walk-forward analysis
Rotate through multiple in-sample and out-of-sample windows. For example, optimize on 2016 to 2018, test on 2019, then roll forward to optimize on 2017 to 2019, test on 2020, and so on. This confirms your rules adapt to changing regimes. A clear primer on this method is available on Investopedia, and overfitting risk is explained on Wikipedia.
Monte Carlo simulation
Once you have a trade distribution, randomize the sequence to simulate different equity paths. This gives you a realistic range of drawdowns and outcomes even when the average edge is unchanged. Learn more about the method on Wikipedia.
Forward testing
Forward testing, or paper trading, runs your strategy live on a demo account. It is slower than backtesting but confirms that signals, fills, and risk controls behave as expected. If you are getting started, see our guide to paper trading and the hands-on trading simulator.
The metrics that matter in forex backtesting
It is tempting to chase the highest return, but sensible traders read the whole picture.
Win rate and expectancy
Expectancy is the average profit per trade in R, where R is risk per trade. A system with a 40 percent win rate can be excellent if average winners are larger than losers.
Profit factor and recovery factor
Profit factor is gross profit divided by gross loss. Values above 1.5 are often considered good. Recovery factor relates net profit to max drawdown and signals efficient use of risk.
Max drawdown and time to recover
Know your worst historical drawdown and how long recovery took. This helps you avoid abandoning the system during a normal slump.
Sharpe and Sortino ratios
These adjust return by volatility. Sortino focuses on downside volatility, which many traders prefer. For refresher definitions, see Sharpe ratio and Sortino ratio on Investopedia.
Trade frequency and capacity
Some edges vanish when you scale size or trade too frequently. Even in liquid forex pairs, spreads and slippage increase with volume or in thin sessions.
Pitfalls that ruin forex strategy backtesting
A great looking equity curve can hide fragile assumptions. Avoid these traps.
Look ahead bias
Never use information in your entry that was not known at the time. For example, do not use the current bar’s closing price to decide on an intrabar entry unless execution truly occurs at the close with certainty.
Survivorship bias
Less critical in forex than equities, but feed selection matters. Some historical feeds clean out bad ticks that you would have faced live. Tests that ignore those spikes may underestimate risk.
Data snooping and overfitting
Resist constant parameter tweaking. The more you optimize, the more likely you curve fit noise. Use coarse grids, penalize complexity, and validate with out-of-sample and walk-forward tests.
Ignoring trading frictions
Backtests without variable spread, slippage, commissions, and swaps look better than reality. Model frictions early and conservatively.
Regime blindness
A strategy that worked in low volatility may fail in crisis conditions. Segment by regime and check that the edge is not concentrated in a single period. For indicator settings and thresholds, review our guide to the RSI indicator.
Practical example: how to backtest a simple forex strategy
To make this concrete, here is a complete workflow for a swing strategy on EUR/USD.
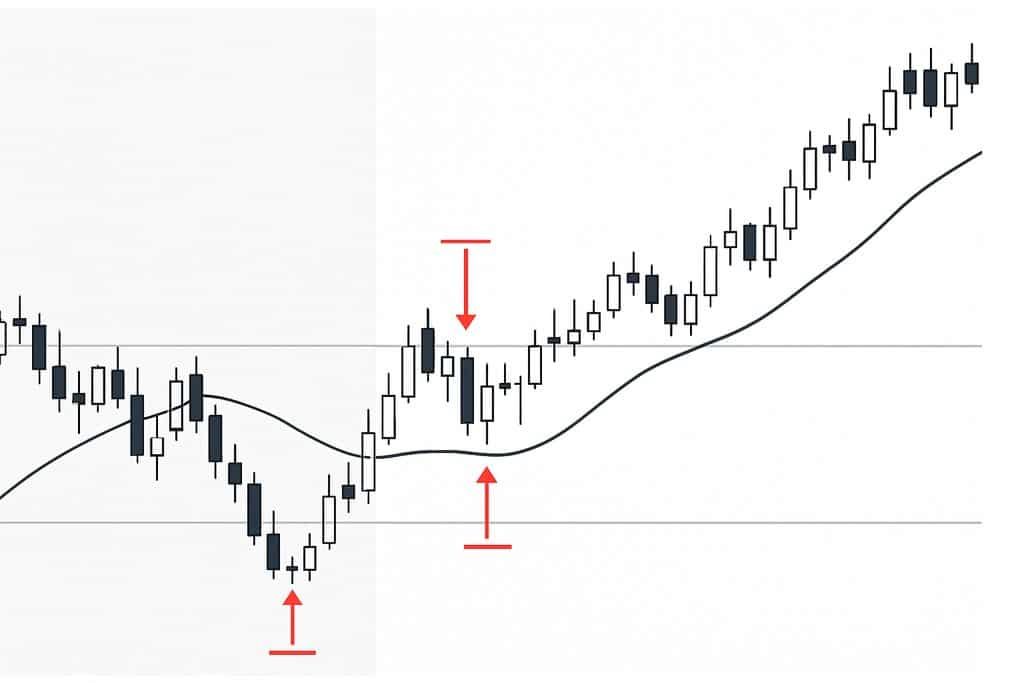
Define the hypothesis
We believe buying pullbacks within an uptrend has positive expectancy. Use a 200 period simple moving average on the 1 hour chart to define the trend and RSI to time pullbacks.
Specify rules precisely
Long entries occur when price is above the 200 SMA, RSI 14 dips below 30 and then crosses back above 30. Stops are 1.5 times the 14 period ATR below the entry candle low. Take profit is set at 2 times the initial risk. Short entries mirror the logic below a falling 200 SMA.
Model execution
All entries occur at the open of the next bar after the signal. Spread is the historical bid ask spread in the data, with a minimum of 0.8 pip and a median of 1.2 pips. Slippage is 0.2 pip on average, doubled during high volatility sessions. Commissions are 7 dollars per million USD traded. Swaps are applied for overnight holds.
Select data
Use 5 years of 1 hour EUR/USD data, including periods with high and low volatility.
Run the backtest
Record each trade’s entry, exit, PnL in pips, R multiple, and timestamps. Segment results by year and by volatility quartile.
Validate
Use the first three years as in-sample, two years out-of-sample. If results hold out-of-sample with similar expectancy and drawdown, continue to walk forward. Run a Monte Carlo shuffle of trade sequences to estimate worst case drawdowns at a 95 percent confidence level.
Interpret
If the strategy shows a profit factor near 1.6, a max drawdown of 7 percent at 1 percent risk per trade, and a stable equity curve across years, you have a reasonable candidate. If the edge vanishes out-of-sample or if all profits come from one short window, it is likely overfit.
Iterate carefully
Add a time filter to avoid entries in the first hour after the London open if that period shows worse slippage, or add a trend strength threshold based on ADX. Keep changes small and revalidate out-of-sample. For a broader framework on building rules, see our guide to trading strategy design.
Manual vs automated forex backtesting
Manual backtesting trains pattern recognition and helps discretionary traders refine entries. You can use a replay feature in charting platforms and record results in a spreadsheet. The downside is speed and the risk of hindsight bias, where you unconsciously favor trades you know worked.
Automated backtesting enforces rules without emotion and scales to more data. You can test hundreds of parameter combinations, run walk-forward analysis, and generate detailed reports. Popular platforms include MetaTrader 4 and 5, and Python libraries such as Backtrader or Zipline. For a quick primer on both approaches, see Investopedia’s backtesting overview.
Forex backtesting in seconds with Obside
If you want the speed of automated testing without coding, Obside’s ultra fast backtesting engine lets you test strategies in seconds and then deploy them directly to your broker or exchange. Describe your idea in plain language to Obside Copilot and it turns that into a concrete strategy, alert, or portfolio rule.
For example, you might write: buy when there is a bullish divergence on RSI on a 15 minutes chart, set a stop loss on the low of the day and a take profit at 10 percent. Obside parses that, runs it on historical data, and shows the equity curve, drawdowns, and performance metrics. Prefer alerts first? Define conditions like notify me if RSI crosses 70 on EUR/USD and MACD turns bearish. You can also mix price, indicators, and events, such as alert me if Bitcoin rises above 150000 dollars and daily volume doubles, or buy 50 dollars worth of Tesla if Elon Musk tweets about it.
Forex traders often want to react to macro news or volatility spikes. With Obside you can trigger orders on real time events, such as sell all my positions if the S&P 500 drops by 10 percent, or rebalance allocations if volatility spikes. Because the same engine powers backtesting and live automation, you keep one consistent rule set from idea to execution. To compare tools, see our guide to the best automated trading platforms.
Benefits and considerations of forex backtesting
The main benefit is confidence. When you put money at risk, you want evidence that your rules have worked before. Backtesting gives you a dataset to guide risk sizing and expectations. You also learn how the system behaves, which makes it easier to stick with during drawdowns. Another benefit is speed. You can test and discard bad ideas quickly, then invest your attention in promising ones.
There are important considerations. Backtests are models of reality, not reality itself. Slippage, latency, and market impact are often worse than you assume. Forex markets evolve as central bank policies shift and liquidity moves between sessions. A strategy that performed well in a low rate environment may struggle when carry costs change. Regularly revalidate strategies and keep assumptions conservative.
Finally, do not neglect risk management. Backtesting should include a clear framework for position sizing, maximum portfolio heat, and a plan for strategy stoppage if performance deviates significantly from expectations.
Conclusion: your next steps
If you searched for forex backtesting, you likely want a reliable, repeatable way to evaluate your ideas. Start by writing precise rules and testing them on quality data with realistic frictions. Validate with out-of-sample periods and walk-forward analysis, and focus on metrics that match your risk tolerance. If you want to iterate faster, use a tool that turns plain English into a tested strategy, such as Obside Copilot. Backtest in seconds, review your equity curve and drawdown, then deploy the same logic with alerts or automated execution when you are ready.
FAQ on forex backtesting
What is a good amount of data for forex backtesting?
For swing strategies on the 4 hour or daily chart, three to five years usually offers enough trades across multiple regimes to judge robustness. For intraday strategies, aim for at least one to two years of tick or minute data to capture session dynamics and spread behavior. More data is not always better if the edge depends on a specific regime, so segment by time period and check consistency.
Do I need tick data to backtest forex strategies?
Tick data helps when your edge depends on microstructure, such as scalping a few pips or exploiting order book dynamics. If your average trade targets 30 to 100 pips and you enter on bar closes, high quality minute or 5 minute data with realistic spreads and slippage is often sufficient. Align data granularity with holding period and execution style.
How should I account for spread, slippage, and swaps?
Include a variable spread that reflects session and volatility. Add a slippage model that worsens during high impact events. Apply swaps for overnight holds based on your broker’s rates. Many backtests fail because these frictions are set to zero.
What performance metrics should I prioritize?
Look at expectancy in R, profit factor, max drawdown, and time to recovery first, then Sharpe or Sortino for risk adjusted context. A smooth equity curve with a manageable drawdown is usually more valuable than a higher return with deep drawdowns.
How do I avoid overfitting in forex backtesting?
Keep rules simple, use coarse parameter grids, validate on out-of-sample data, and run walk-forward analysis. Penalize complexity by favoring strategies that require fewer filters or parameters to retain their edge. Monte Carlo analysis helps gauge how fragile results are to trade sequence randomness.
Can I backtest news based forex strategies?
Yes, but you must model widened spreads and slippage during releases. Event time filtering and realistic cost assumptions are crucial. Platforms that integrate news triggers and event data, like Obside, can help simulate both logic and execution conditions more accurately. For turning headlines into decisions, see our Trading News Hub.
Create your free Obside account