Technical Analysis: Read Markets Like a Pro (Guide)
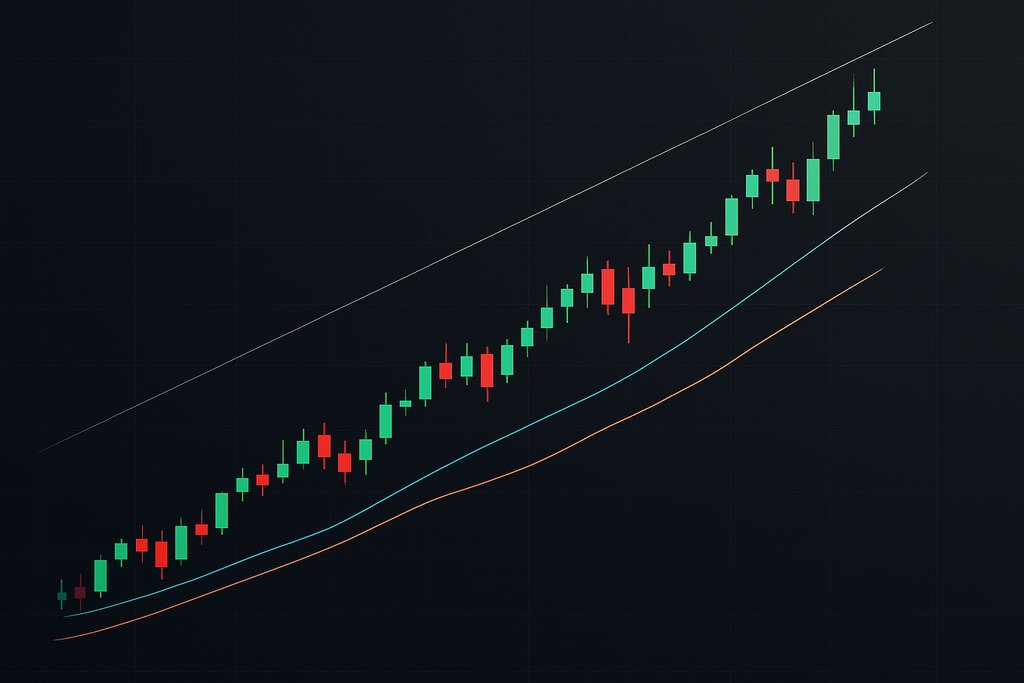
Learn how technical analysis provides a clear, repeatable framework for reading price, volume, and momentum so you can time entries and exits with confidence. This comprehensive guide explains core concepts, essential indicators, and chart patterns, then shows you how to build, test, and refine rule-based strategies with practical, ready-to-use examples and checklists. You’ll also discover ways to automate alerts, orders, and full strategies with modern tools, helping your plan run consistently even when you’re away from the screen.
M Pattern Trading: Master the Double Top Strategy Now
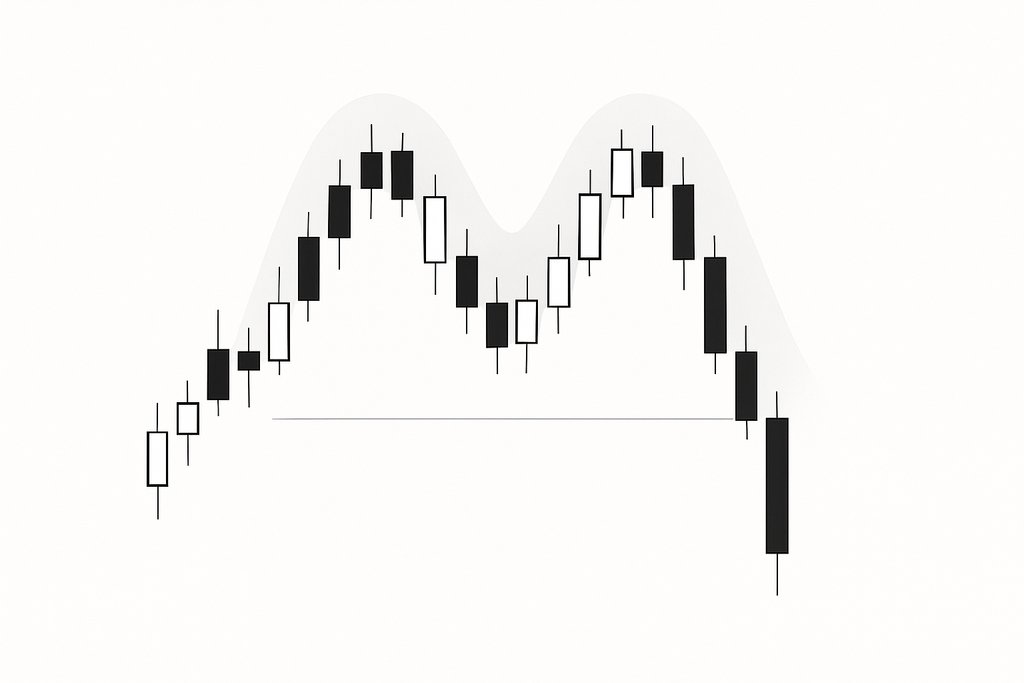
This guide explains how to identify and trade the M pattern—also known as the double top—with clear rules for timing, confirmation, and risk control. You’ll learn how to validate the pattern, avoid false breakouts, and set precise entries, stops, and targets across markets and timeframes. It also outlines practical, automatable steps so you can act decisively when the setup forms without getting caught by noisy swings.
W Pattern Trading: Complete, Practical Double Bottom Guide
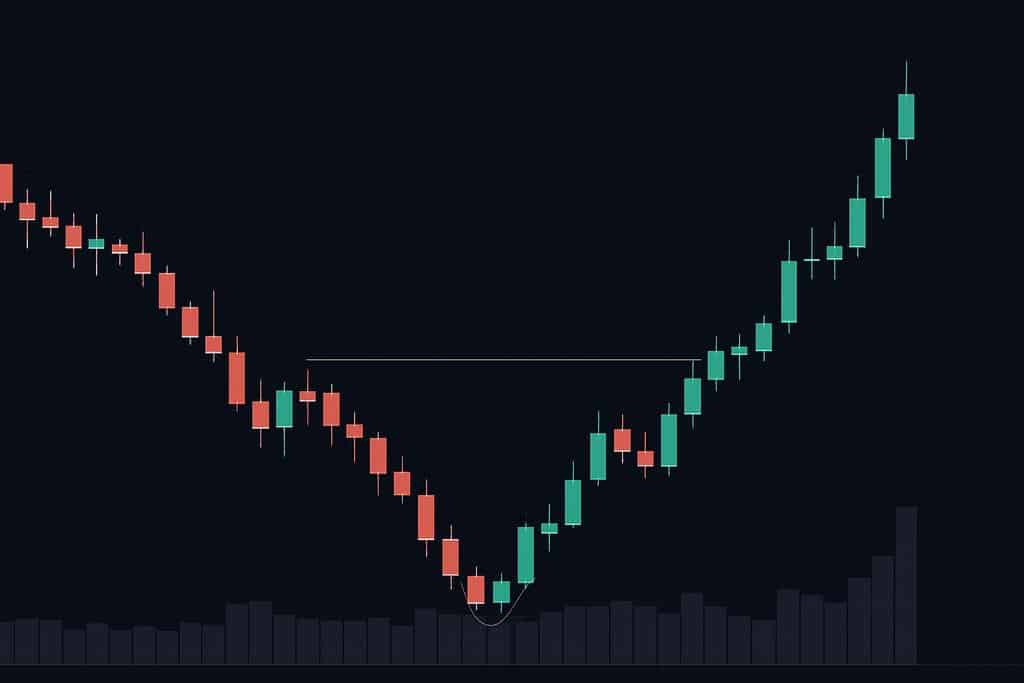
This guide explains W pattern trading, also known as the double bottom reversal, and shows how to identify, validate, and execute the setup with precision. You’ll learn practical rules for entries, stop placement, profit targets, and risk management, plus tips to avoid false breakouts and mistimed trades. The article also covers ways to systematize and automate the strategy for more consistent performance.
RSI Indicator: How It Works, Settings, and Strategy

This guide explains the RSI indicator in clear, practical terms so you can time entries and exits with more discipline. You’ll learn how RSI measures momentum, why overbought and oversold levels behave differently in trends versus ranges, and how to adjust periods and thresholds for your market and timeframe. The article covers common pitfalls, divergence signals, and step‑by‑step rules you can backtest and even automate, helping you turn RSI from a vague oscillator into a repeatable trading edge.