M Pattern Trading: Master the Double Top Strategy Now
Learn how to spot, confirm, and trade the M pattern with clear entries, disciplined risk, and automation so you never miss the move.

Most traders who search for m pattern trading want to know how to spot an M-shaped reversal early enough to act without getting trapped by false breaks and noisy swings. The double top is one of the most recognizable reversal formations, yet outcomes depend on timing, confirmation, and disciplined risk control. This guide gives you a precise framework to identify, validate, and trade M patterns across markets and timeframes, with concrete steps you can automate so you do not miss the move.
Table of contents
- What is M Pattern Trading
- Structure of the M Pattern
- Confirmation and Entry
- Risk Management
- Timeframe and Market Context
- Step-by-step Playbook
- Realistic Examples
- Benefits and Considerations
- Automate with Obside
- Actionable Next Steps
- FAQs
- Related articles
What is M Pattern Trading
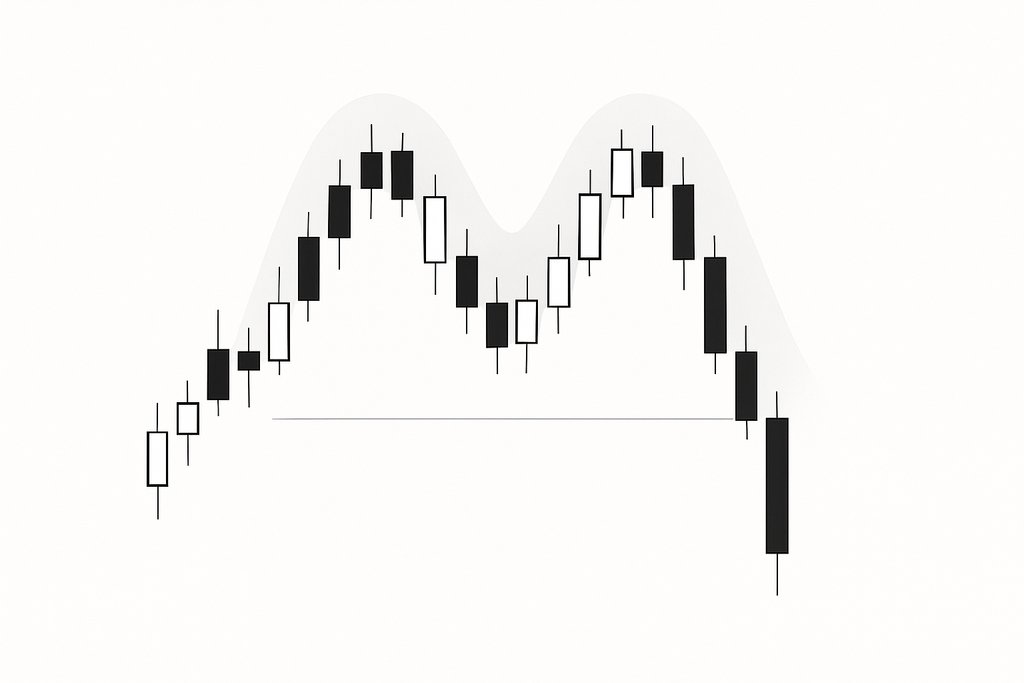
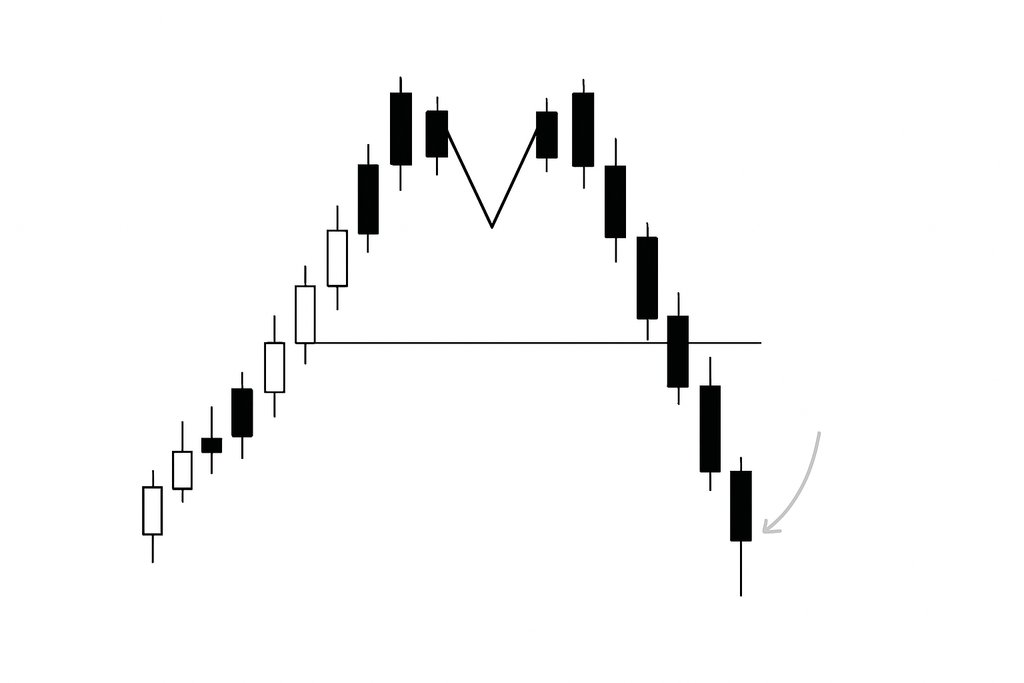
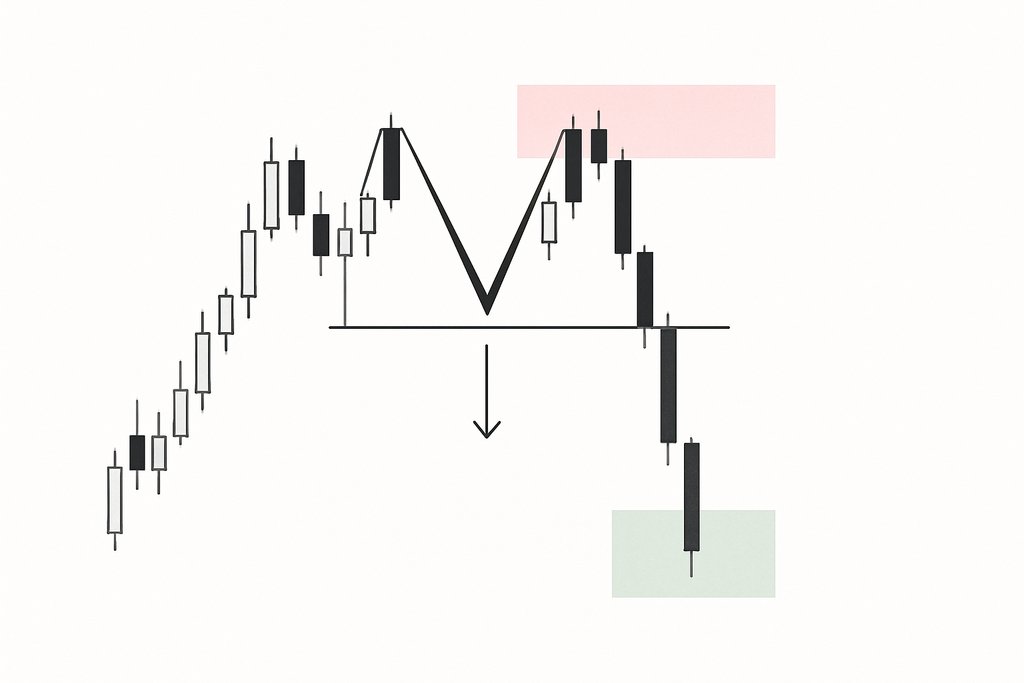
M pattern trading focuses on exploiting the double top reversal. Price forms two swing highs at or near the same level, separated by a moderate trough. The pattern builds a visual M. The low of that trough is the neckline. When price breaks below the neckline after the second peak, the pattern is considered confirmed and a downward move often follows.
The psychology is straightforward. The first top attracts sellers at a visible resistance level. Buyers push back and attempt a second run, but they fail to print a higher high with authority. This failure reveals supply overwhelming demand. Once the neckline gives way, late longs rush to exit and short sellers join the move, creating momentum. For the opposite pattern, see our guide to W pattern trading and double bottoms.
If you want a baseline definition and diagrams, see the Investopedia entry on the double top pattern as a general reference: Double Top on Investopedia. For broader context on chart structures, the Wikipedia page is also helpful: Chart pattern on Wikipedia.
The Structure of an M Pattern: Components That Matter
The cleanest M patterns share traits that improve reliability and tradability. First, there should be a prior uptrend. Reversal patterns carry more weight when they reverse something. A flat or choppy prelude reduces the edge. Second, the two highs should be reasonably close in price, commonly within 1 to 3 percent for liquid large caps or major FX pairs, and sometimes wider for volatile assets like crypto. The neckline should be clearly defined by the trough between the two tops and should not be cluttered by multiple minor lows that blur the reference.
Volume adds an important layer. Many traders prefer to see volume lighter on the second peak compared to the first, which suggests buyer exhaustion. Rising volume on the break of the neckline is a classic confirmation signal. On intraday charts, liquidity pockets and session opens can distort volume, so context is key.
Time symmetry also matters. If the second top forms too quickly without a meaningful pause, the pattern can be a whipsaw. If it drags on for too long and price meanders around the highs, the market may be consolidating rather than reversing. These are tendencies, not hard rules.
Confirmation and Entry: Neckline Breaks, Retests, and Timing
An M pattern is not confirmed until price closes below the neckline on the timeframe you trade. Intrabar dips below the neckline are common, especially in volatile products, and often snap back. Conservative traders wait for a decisive close under the neckline to reduce the risk of a bear trap.
Two popular entry tactics are widely used. The first is the breakout entry on the first close below the neckline. This captures momentum but can expose you to a sharp retest. The second is the retest entry. You wait for price to break the neckline, rebound, and fail near the neckline from below. This often provides a tighter stop and better reward to risk, but retests do not always occur.
Several confirmation tools help filter signals. RSI divergence, where RSI fails to make a higher high on the second top, adds confidence. A bearish MACD cross into the neckline break reinforces momentum. If you are trading futures or equities, you can also watch order flow around the neckline, looking for absorption on the retest that indicates supply dominance. Learn more in our RSI indicator guide.
Breakout vs retest entries
| Entry | Pros | Cons |
|---|---|---|
| Breakout close | Captures momentum | Higher whipsaw risk |
| Retest failure | Tighter stop, better R:R | May miss the move |
Risk Management: Stop Placement and Profit Targets
A consistent risk plan often matters more than the pattern itself. Many traders set the initial stop just above the second top. This is simple and often effective because the pattern thesis is invalid if price breaks above that high. If you enter on a neckline retest and get a quick reaction lower, you can tighten the stop above the retest pivot to reduce risk.
Targets are commonly projected using the height of the pattern. Measure the vertical distance from the peaks to the neckline. Subtract that distance from the neckline break to generate a measured move objective. Combine the measured move with nearby support zones, Fibonacci retracements, or anchored VWAP levels to refine exits.
Trailing stops help you participate in larger trend reversals. A volatility-based trailing stop, such as a multiple of ATR, adapts to conditions and avoids premature exits on minor bounces.
Timeframe, Market, and Context
M pattern trading works on daily charts, 4-hour charts, and even 5-minute charts, but context drives expectancy. On higher timeframes, the pattern often captures significant swing reversals and attracts institutional participation. On lower timeframes, noise increases, which calls for tighter stops, smaller position sizes, and stricter confirmation.
Every market has its nuance. In FX, session overlaps and macro catalysts can cause neckline fakeouts, so patience around major releases helps. In crypto, weekend liquidity can exaggerate spikes at the neckline. In large-cap equities, earnings and news often shape the second top or the break, so placing trades well ahead of scheduled catalysts can be risky.
Trend alignment helps. An M pattern forming under a long-term descending moving average displays confluence. If the broader trend is still strongly up, consider conservative targets or partial profits, since the pattern might devolve into a range.
A Step-by-Step Playbook for M Pattern Trading
Begin with detection. Identify a prior uptrend that has stretched into a known resistance zone. Mark the first swing high and then the pullback low, which becomes your provisional neckline. When price pushes back to the same area and stalls, you have the second top candidate. Check momentum and volume. If the second top forms on lower momentum or lighter volume, stand ready.
Wait for confirmation on your chosen timeframe. If you prefer a breakout entry, place the short on the close below the neckline or use a stop order slightly below it to enter if price pushes further. Set your initial stop above the second top. Compute your pattern height to plot the measured move objective and ensure the reward to risk is at least two to one. If not, pass on the trade or switch to a retest entry.
For a retest entry, let price rebound toward the neckline. Look for rejection signals near that level such as upper wicks, bearish engulfing candles, or a failure of RSI to reclaim 50. Enter on the rejection and set a tighter stop just above the retest high. As price moves in your favor, consider taking partial profits at one times risk, then trail the rest using a multiple of ATR.
Two tactical additions can improve consistency. First, incorporate a time stop. If the pattern breaks and price does not follow through within a set number of bars, exit and move on. Second, track correlated assets and indexes. Alignment across a sector or index increases conviction.
Realistic Examples With Numbers
Imagine Bitcoin on a 4-hour chart rallies from 60,000 to 66,400, then pulls back to 64,800. Price then retests 66,300 but cannot push a new high. RSI prints 68 on the first top and 63 on the second. Volume is lighter on the second push. The neckline is 64,800. You wait for a 4-hour close below 64,800, which prints at 64,600. You enter short at 64,580 with a stop at 66,380. The pattern height is 1,600, which projects a target near 63,200. As price reaches 63,600 you scale a third, move your stop to breakeven, and let the rest trail 2.5 ATR.
Consider Apple on a daily chart. The stock peaks near 192, dips to 186, then retests 191 with a long upper shadow. The neckline is 186. A daily close at 185.60 confirms the break. You short at 185.50 with a stop at 191.40. The height is roughly 6, so your target is near 180. Respect nearby support at 181. If price hesitates there, take partial profits and trail the balance.

Benefits and Considerations of M Pattern Trading
The primary benefit is clarity. The structure is visible to many participants, which helps create self-reinforcing behavior around the neckline. The entry, stop, and target are easy to define, improving discipline and making risk management straightforward. The pattern adapts well across markets and timeframes, from swing trades on equities to tactical shorts in crypto.
- Clear entries and invalidation levels
- Objective targets via measured moves
- Works across markets and timeframes
There are tradeoffs. The pattern attracts false breaks during choppy conditions and around news, so confirmation and patience matter. Measured moves are guidelines, not guarantees. Context is critical. Confluence with momentum divergence and volume confirmation increases odds.

Automate M Pattern Trading with Obside: Alerts, Orders, and Backtests
Many traders miss confirmations because they cannot watch every chart. Obside turns plain language into live alerts and automated actions. Describe the M pattern you want to track, and Obside Copilot translates it into conditions tied to price, indicators, and timeframes. With ultra-fast backtests, you can validate rules in seconds, then run them automatically with your connected brokers and exchanges. Obside won the Innovation Prize 2024 at the Paris Trading Expo and is supported by Microsoft for Startups.

Tell Obside: Alert me if BTC on the 4-hour chart forms two local highs within 1 percent, RSI on the second high is lower, and the candle closes below the trough. Then sell $1,000 of BTC, set the stop above the second top, and target the measured move. You can also split logic for a retest entry. Learn more about trading automation from idea to execution and building and backtesting strategies.
# Obside pseudo-rules for an M pattern short
when:
  two_local_highs within 1% over 20 bars
  rsi(second_high) < rsi(first_high)
  close < trough_low  # neckline close
then:
  sell amount: 1000 USD
  stop: above second_high
  take_profit: measured_move
  trail: 2*ATR
risk:
  max_daily_loss: 2%
Prefer a platform overview before building? See how to choose an algorithmic trading platform and compare automated trading bots.
Actionable Next Steps
Start by picking one market and one timeframe so you can build a repeatable process. Mark recent swing highs and lows to get used to spotting clean M structures. Add RSI and volume to your chart and note whether the second top carries weaker momentum and lighter activity. Commit to a confirmation trigger and write down the exact rule you will follow so there is no hesitation when the pattern forms.
Translate those rules into alerts and actions inside Obside. Ask for reminders when price approaches a prior top, then confirmations on neckline breaks, then automated orders if your rules are met. Run a quick backtest to validate your settings and refine them until the performance fits your risk tolerance. Once live, keep notes on each trade and use these insights to keep improving.
FAQs: M Pattern Trading
What is the difference between an M pattern and a double top?
There is no difference in practical trading terms. M pattern trading is simply the act of trading the double top reversal. The two highs form the M shape and the neckline is the trough between them. Confirmation occurs when price breaks and closes below the neckline.
Do I need RSI divergence to trade an M pattern?
RSI divergence is not mandatory, but it improves quality. If the second top shows weaker momentum on RSI compared to the first, it signals potential exhaustion. You can trade without divergence if other factors align, such as strong volume expansion on the neckline break or broader market weakness.
Where should I place my stop loss on a double top?
A common approach is to place the stop just above the second top, which invalidates the setup if hit. If you enter on a retest of the neckline from below, you can tuck the stop above the retest high to reduce risk, provided the trade still has room to breathe.
How do I set profit targets for m pattern trading?
Use the measured move as a baseline. Measure the distance from the peaks to the neckline and project that below the break. Combine that target with nearby support levels and consider taking partial profits along the way. A trailing stop can help capture larger reversals if momentum accelerates.
Does the M pattern work on intraday charts?
Yes, but noise increases as you go down in timeframe. Intraday traders benefit from stricter confirmation rules and volatility-aware stops. Backtest your rules on the exact timeframe and instrument you trade, since microstructure varies by market.
How can I automate M pattern alerts?
With Obside, describe your pattern in plain language. For example, ask for an alert when price prints two local highs within a small range, RSI on the second high is lower, and the candle closes below the intermediate low. You can add automatic orders with defined stops and targets, then validate everything with a quick backtest.
