
What AI Trading Actually Costs (Fees, Spreads, Slippage)
The full AI trading cost stack, itemized, then one strategy run at 5 vs 50 trades a month so you can see exactly what frequency costs you.
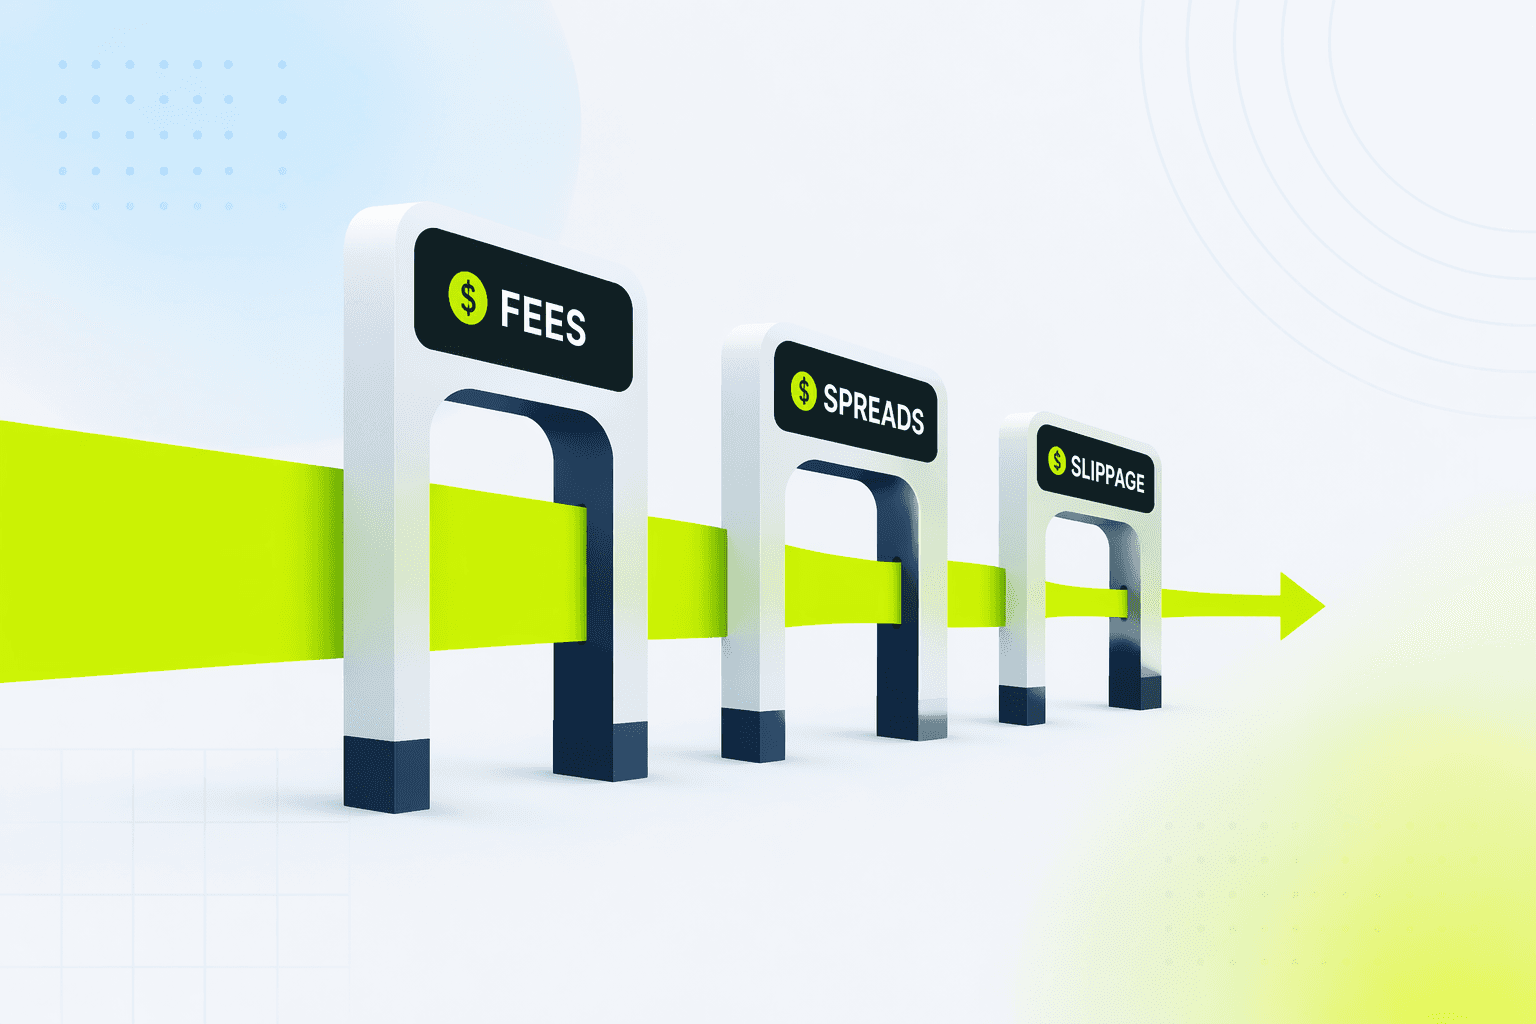
An AI agent that trades for you still pays the same tolls you would: commissions, spreads, slippage. What changes is how often it pays them. Most discussions of AI trading cost stop at the subscription price, which is usually the smallest line on the bill.
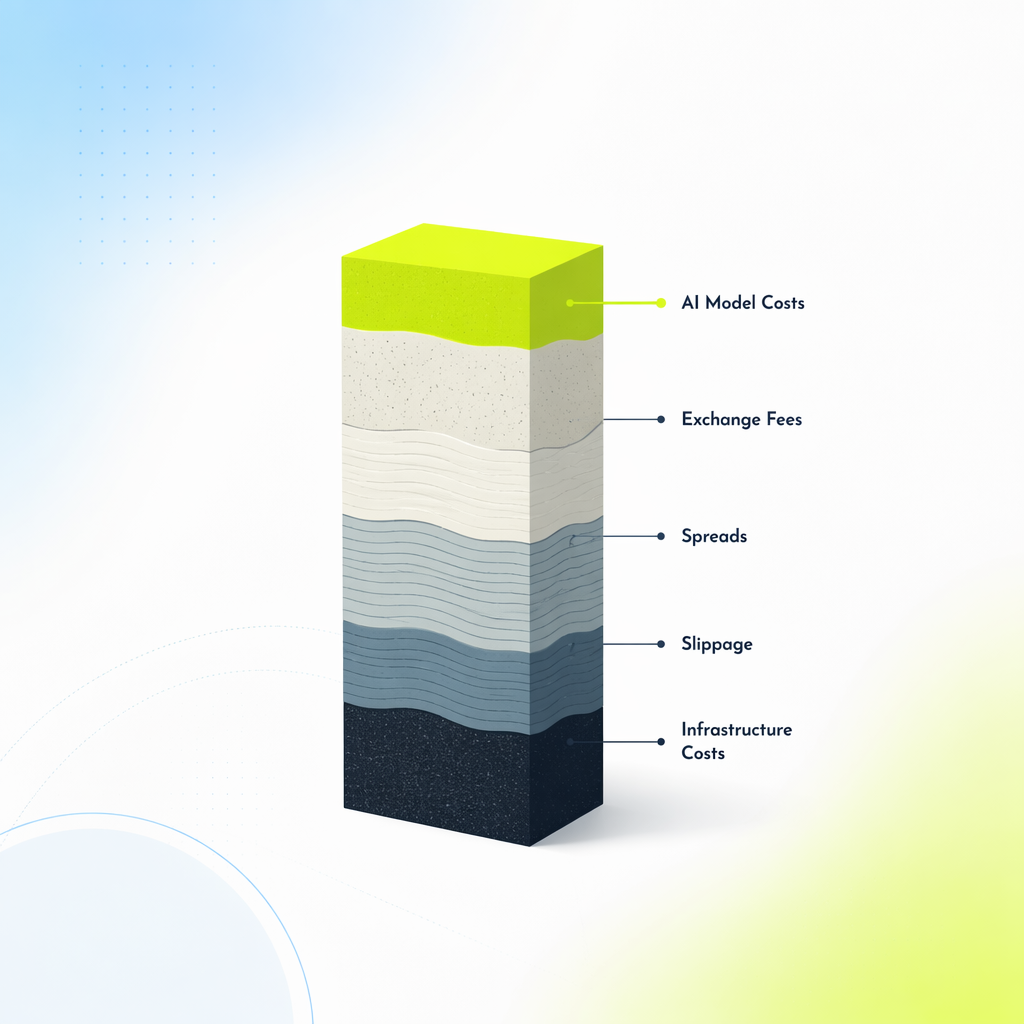
This article itemizes the full stack (platform fees, commissions, spreads, slippage, funding, currency conversion), then runs one strategy at 5 and at 50 trades a month so you can see, in dollars, what frequency actually costs. By the end, you'll know which costs to negotiate, which to design around, and which to simply accept.
The AI trading cost stack, line by line
Six line items, from the most visible to the least.
Platform subscription or credits. The fee the platform charges for the automation layer itself, whether flat monthly or usage-based. It is fixed relative to your trading, so its real weight depends on account size: $30 a month is $360 a year, which is 0.36% of a $100,000 account and 7.2% of a $5,000 account. Same product, twenty times the drag.
Commissions. What your exchange or broker charges per executed order, usually per side. Crypto spot exchanges commonly charge around 0.1% for taker orders at retail tiers, less for makers. Many stock brokers advertise zero commission, but execution quality varies, and options or non-US venues usually still charge per contract or per order.
Spread. The gap between the best bid and the best ask. Every market order crosses it, paying roughly half the spread relative to the mid-price on entry and again on exit. On liquid large caps and major crypto pairs it's tight; on small caps, altcoins, or off-hours sessions it widens sharply. Spread is invisible on your statement, which is exactly why it compounds unnoticed.
Slippage. The difference between the price that triggered your decision and the price you actually got filled at. It grows with order size, urgency, and thin liquidity. The uncomfortable part for automation: agents are precisely the participants trading at 3 a.m. or in the seconds after a news print, which is when slippage is worst.
Funding rates. If your agent trades perpetual futures, longs and shorts exchange periodic funding payments. In a crowded directional market, holding the popular side of a perp can cost a meaningful annualized rate, and the sign can flip on you. A position that looks free to hold on the fee schedule may not be.
Currency conversion. A euro-denominated account buying dollar-denominated assets pays a conversion cost on the way in and again on the way out. For frequent traders in foreign markets this becomes a genuine per-round-trip cost, not a one-off.
One strategy at 5 vs 50 trades a month, computed
Now the part nobody itemizes. Take a single swing strategy on a $10,000 account, average position size $2,000 per trade. To keep the arithmetic honest, assume illustrative but plausible per-side costs: 0.10% commission, 0.05% for crossing the spread, and 0.10% slippage. These are stated assumptions, not measurements; your venue may be cheaper or worse, and you should redo this table with your own numbers.
Per side, that's 0.25% of position value. A full round trip (entry plus exit) costs 0.50% of the position: $10 on a $2,000 trade. Add a $30 monthly platform subscription. Here is the same strategy at two frequencies over one year:
| Cost line (annual) | 5 trades/month (60 round trips) | 50 trades/month (600 round trips) |
|---|---|---|
| Commissions (0.20% per round trip) | $240 | $2,400 |
| Spread (0.10% per round trip) | $120 | $1,200 |
| Slippage (0.20% per round trip) | $240 | $2,400 |
| Platform subscription ($30/month) | $360 | $360 |
| Total annual cost | $960 | $6,360 |
| As % of the $10,000 account | 9.6% | 63.6% |
Read that last row again. The low-frequency version must earn 9.6% gross in a year just to break even, which is already demanding. The high-frequency version must earn 63.6% gross before you keep a single dollar. Every round trip faces the same 0.5% hurdle before it contributes anything, and the 50-trade version has to find ten times as many opportunities that each clear it.
This is why frequency is the single most important cost decision in automated trading. Not the subscription. Not the commission tier. How often the agent trades.
Two refinements worth noting. First, fixed costs favor larger accounts: the $360 subscription is the biggest line at 5 trades a month but a rounding error at 50. Second, slippage does not scale linearly: if the higher-frequency variant also trades faster signals in thinner moments, its true per-trade slippage is probably higher than the flat 0.2% assumed here, making the comparison generous to the fast version.
The hidden cost: overtrading feels free
The most expensive property of automation is psychological, not technical. When executing a trade costs you nothing in effort (no order ticket, no screen time, no 3 a.m. alarm), the natural brake on trading frequency disappears. An agent will trade exactly as often as its rules allow, without the reluctance a human feels on the fortieth trade of the month.
That's the trap: each additional trigger you add feels like adding opportunity, when the table above says it's adding hurdle. A rule that fires 600 times a year needs to be dramatically better than one that fires 60 times, and few retail signals are.
The fix is structural, not motivational. Put a trade-rate limit on the agent (say, a maximum number of entries per week). Demand that every added condition justify itself in a cost-inclusive backtest, not on the zero-cost equity curve. And treat rising turnover in a live agent as a warning to investigate, the same way you'd treat rising drawdown. Several of the classic AI trading mistakes reduce to exactly this: paying the cost stack more often than the edge justifies.
How to read a strategy's cost sensitivity in a backtest
Before an agent trades real money, you can measure how fragile its edge is to costs. The protocol takes three backtest runs of the identical strategy:
- Zero-cost run. No commissions, no slippage. This is the strategy's theoretical ceiling and nothing more.
- Realistic run. Your actual fee tier, a measured typical spread, and a slippage assumption appropriate to the asset and time of day.
- Pessimistic run. Double the slippage, widen the spread. This approximates a bad liquidity regime.
Then compare. If the equity curve is strong at zero cost and flat or negative in the realistic run, the "edge" was microstructure noise: the strategy was collecting moves smaller than the toll to collect them. If the realistic run holds up but the pessimistic run collapses, the strategy is viable but fragile, and deserves smaller size and liquid assets only.
One ratio summarizes it: average gross profit per round trip divided by cost per round trip. Below about 2, costs own your strategy and one bad fill erases a winner. The higher the multiple, the more regime-proof the edge. High-turnover strategies almost always score worse on this ratio than their equity curves suggest, which is the quantitative reason slow strategies survive live trading more often.
This is also a test to run on any platform you evaluate: does its backtester model costs at all? Obside's Backtesting Engine bakes slippage assumptions into every historical replay, so the cost drag is visible in the report before you pay it live, and the same agent definition then moves to paper trading unchanged. The mechanics of running that validation properly are covered in how to backtest an AI trading agent.

What's worth paying for, and what isn't
Not all costs are drag. Some buy you protection or information that cheaper setups lack.
Worth paying for:
- Execution-time risk controls. Position sizing, stops, and drawdown caps enforced at the moment an order routes. This is insurance against your worst day, and its value shows up exactly once, when it matters.
- Cost-aware backtesting and quality data. A backtest without slippage modeling is a marketing document. Clean historical data across regimes is what makes the three-run protocol above meaningful.
- Intent transparency. A platform that restates your plain-language strategy as precise conditions before running it prevents expensive misunderstandings — a mistranslated rule can cost more than a decade of subscriptions.
Not worth paying for:
- Signals you can't audit. A subscription to buy/sell calls with no visible logic and no track-record methodology is a cost with unverifiable benefit.
- Speed you don't need. Retail swing and position strategies gain nothing from ultra-low-latency execution. Paying for it is paying for someone else's use case.
- Premium tiers on small accounts. Recompute the fixed-cost percentage from the first section. If platform fees exceed roughly 1–2% of your account per year, either the account needs to grow or the tier needs to shrink.
A fuller framework for weighing these trade-offs sits in how to choose an agentic trading platform, and the broader market context in our comparison of automated trading platforms.
Where to go from here
Run your own version of the 5-vs-50 table with your real fee tier, your typical position size, and an honest slippage guess. Most traders who do this once permanently change how they design automations: fewer triggers, more liquid assets, and a hurdle rate every rule must clear. If you want the cost drag computed for you before any capital moves, Obside backtests your strategy with slippage assumptions included and lets you rehearse it in paper mode until the numbers, net of costs, still make the case.
Educational content only. This is not investment advice. Trading involves risk, including possible loss of capital.
FAQ
It depends far more on trading frequency than on the subscription. The platform fee is fixed, but commissions, spread, and slippage scale with every round trip. In the worked example above, an illustrative 0.5% cost per round trip turns 50 monthly trades on a $10,000 account into roughly $530 a month in total costs, versus about $80 a month at 5 trades. Compute your own per-round-trip cost first; the monthly bill follows from it.